This study applies a multivariate climatic framework to evaluate how interacting long-term changes in minimum temperature, snowfall, and precipitation contribute to species decline and local extirpation in Michigan. We integrate 129 years of minimum temperature data, 64 years of precipitation records, and multi-decadal snowfall measurements with species-occurrence histories to quantify climatic pressures driving documented losses. The analysis shows a pronounced post-2000 rise in winter minimum temperatures marked by the near disappearance of extreme cold events (e.g., February minimums rising from –30°F to –9°F). These warmer minimum temperatures disrupt key ecological pathways by reducing the duration and intensity of cold-dependent physiological cues, increasing overwinter metabolic stress, and expanding predator and pathogen survival windows. Concurrent declines in January–February snowpack and the virtual loss of April snowfall further compound risk by diminishing the insulating snow layer essential for thermal buffering, hibernation stability, and protection of subnivean microhabitats. Precipitation patterns reveal increasing seasonal imbalance, with reduced summer rainfall and elevated spring and autumn precipitation, altering hydrological stability, breeding-site persistence, and seasonal habitat quality. To evaluate species responses, we develop synthetic K-Nearest Neighbors (KNN) population models for several climate-sensitive taxa-including Blanchard’s Cricket Frog, American Goshawk, Kirtland’s Snake, and the Long-eared Owl-which represent a novel integration of long-term multi-variable climate anomalies with data-driven population modeling. These models show coherent seasonal and interannual population declines that align with observed climatic anomalies, highlighting the combined effects of winter warming, snowpack loss, and altered moisture regimes on demographic resilience. A broader historical comparison further indicates a shift in the dominant drivers of biodiversity loss: whereas early extirpations were primarily linked to habitat conversion, recent and ongoing declines increasingly stem from the interaction of climatic warming with persistent habitat degradation. The findings demonstrate that no single climatic factor explains extirpation patterns; instead, vulnerability emerges from interacting climatic stressors that reshape overwintering conditions, hydrological cycles, and habitat suitability. By merging long-term climate datasets with synthetic KNN population modeling, this study advances tools for assessing climate-driven extinction risk and provides actionable insight for conservation planning in the Great Lakes region.
| Published in | International Journal of Environmental Monitoring and Analysis (Volume 13, Issue 6) |
| DOI | 10.11648/j.ijema.20251306.14 |
| Page(s) | 328-346 |
| Creative Commons |
This is an Open Access article, distributed under the terms of the Creative Commons Attribution 4.0 International License (http://creativecommons.org/licenses/by/4.0/), which permits unrestricted use, distribution and reproduction in any medium or format, provided the original work is properly cited. |
| Copyright |
Copyright © The Author(s), 2025. Published by Science Publishing Group |
Climate Anomalies, Species Extirpation, K-Nearest Neighbors (KNN) Modeling, Biodiversity Decline, Temperature, Precipitation, Snowfall Trends, Multivariate Climate Analysis
Variable | Metric | Measurement Approach |
|---|---|---|
Minimum Temperature | °F | Monthly EMNT from GSOM dataset |
Precipitation | mm | Monthly total from daily precipitation sums |
Snow Depth | mm | Monthly total from daily snow depth sums |
Species Population | Individuals (synthetic) | KNN-generated monthly population estimates based on last observed occurrences |
Population Decline | % change per month | Derived from KNN-generated time series |
Climate–Population Association | Pearson r | Correlation between population and climate variables |
Extreme Event Identification | Threshold deviation | Monthly deviation from 30-year climatological mean |
Date | EMNT | EMXT | TAVG | TMAX | TMIN |
|---|---|---|---|---|---|
1896 Jun | 45 | 84 | 67.9 | 77.8 | 58 |
1896 Jul | 50 | 86 | 69.4 | 77.9 | 60.7 |
1896 Aug | 42.1 | 87.1 | 69.3 | 77.3 | 61.3 |
1896 Sep | 30.9 | 82.9 | 58.5 | 65.8 | 51.1 |
1896 Oct | 25 | 73.9 | 46.1 | 54.3 | 37.8 |
1896 Nov | 12.9 | 62.1 | 37.4 | 43 | 31.9 |
1896 Dec | 10 | 50 | 30.6 | 35.2 | 26 |
1897 Jan | -0.9 | 57 | 23.8 | 29.3 | 18.4 |
1897 Feb | 6.1 | 37.9 | 26.4 | 31.4 | 21.5 |
1897 Mar | -11 | 64 | 30.4 | 37.4 | 23.4 |
… | … | … | … | … | … |
2024 Mar | 18.1 | 72 | 41.7 | 50.1 | 33.4 |
2024 Apr | 32 | 77 | 51.4 | 60.7 | 42.2 |
2024 May | 41 | 88 | 62.5 | 74.1 | 50.9 |
2024 Jun | 42.1 | 93 | 70.2 | 79.5 | 60.9 |
2024 Jul | 46 | 88 | 71.3 | 80.6 | 62 |
2024 Aug | 50 | 91 | 71.9 | 81 | 62.7 |
2024 Sep | 42.1 | 90 | 67 | 79.3 | 54.8 |
2024 Oct | 29.1 | 77 | 55.2 | 66.6 | 43.8 |
2024 Nov | 25.2 | 66.9 | 45.6 | 51.5 | 39.6 |
2024 Dec | 12.2 | 53.1 | 33.9 | 39 | 28.9 |
2025 Jan | 2.1 | 46 | 26 | 31.8 | 20.2 |
Scientific Name | Common Name | State Status | Global Rank | State Rank | Occurrences in County | Last Observed in County |
|---|---|---|---|---|---|---|
Rorippa aquatica | Lake cress | SC | G4* | S2 | 1 | 1898 |
Lithospermum latifolium | Broad-leaved puccoon | SC | G4 | S2 | 1 | 1899 |
Triphora trianthophora | Nodding pogonia or three birds orchid | T | G4* | S1 | 1 | 1899 |
Euphorbia commutata | Tinted spurge | T | G5 | S1 | 1 | 1901 |
… | … | … | … | … | … | … |
Glyptemys insculpta | Wood turtle | T | G2G3 | S2 | 11 | 2024 |
Lithobates palustris | Pickerel frog | SC | G5 | S3S4 | 3 | 2024 |
Pantherophis spiloides | Gray rat snake | SC | G4G5 | S2S3 | 4 | 2024 |
Plebejus samuelis | Karner blue | T | G1G2 | S2 | 37 | 2024 |
Terrapene carolina carolina | Eastern box turtle | T | G5T5 | S2S3 | 26 | 2024 |
Global Rank | ||||||
G1 | Critically imperiled globally because of extreme rarity (5 or fewer occurrences range-wide or very few remaining individuals) or because of some factor(s) making it especially vulnerable to extinction. | |||||
G2 | Imperiled globally because of rarity (6 to 20 occurrences or few remaining individuals or acres) or because of some factor(s) making it very vulnerable to extinction throughout its range. | |||||
G3 | Either very rare and local throughout its range or found locally in a restricted range (e.g. a single western state, a physiographic region in the East) or because of other factor(s) making it vulnerable to extinction throughout its range; in terms of occurrences, in the range of 21 to 100. | |||||
G4 | Apparently secure globally, though it may be quite rare in parts of its range, especially at the periphery. | |||||
G5 | Demonstrably secure globally, though it may be quite rare in parts of its range. | |||||
State Rank | ||||||
S1 | Critically imperiled in the state because of extreme rarity (5 or fewer occurrences or very few remaining individuals) or because of some factor(s) making it especially vulnerable to extirpation in the state. | |||||
S2 | Imperiled in state because of rarity (6 to 20 occurrences or few remaining individuals or acres) or because of some factor(s) making it very vulnerable to extirpation from the state. | |||||
S3 | Rare or uncommon in state (on the order of 21 to 100 occurrences). | |||||
S4 | Apparently secure in state, with many occurrences. | |||||
__* | Data is insufficient, outdated, or incomplete. | |||||
Month | Precipitation mm | Snow Depth mm |
|---|---|---|
1959 May | 56.5 | 0 |
1959 Jun | 29.3 | 0 |
1959 Jul | 129.1 | 0 |
1959 Aug | 98.1 | 0 |
1959 Sep | 64.7 | 0 |
1959 Oct | 126.8 | 0 |
1959 Nov | 75.5 | 202 |
1959 Dec | 56.7 | 228 |
1960 Jan | 73.2 | 1601 |
1960 Feb | 67.5 | 3636 |
… | … | … |
2022 Oct | 46.8 | 0 |
2022 Nov | 27.1 | 440 |
2022 Dec | 32 | 1230 |
2023 Jan | 49.3 | 840 |
2023 Feb | 79.7 | 790 |
2023 Mar | 114.7 | 670 |
2023 Apr | 98.8 | 0 |
2023 May | 24.5 | 0 |
2023 Jun | 22.7 | 0 |
2023 Jul | 158.5 | 0 |
2023 Aug | 105.2 | 0 |
Common Name | Last Observed | Notes |
|---|---|---|
Lake sturgeon | 2015 | Cold-water fish; warmer winters reduce suitable spawning conditions and alter river thermal regimes; also impacted by damming & overfishing |
Wild rice | 2016 | Aquatic plant; sensitive to warmer water temperatures during winter and early spring; hydrological changes exacerbate stress |
Cerulean warbler | 2013 | Migratory bird; warmer winters shift insect emergence and breeding timing, affecting food availability |
Prothonotary warbler | 2005 | Wetland-dependent; warmer winters modify wetland hydrology and breeding habitat quality |
Black tern | 2005 | Wetland bird; altered winter temperatures impact prey populations and wetland conditions |
Red-shouldered hawk | 2014 | Forest raptor; warmer winters affect prey dynamics and nesting success |
Hooded warbler | 2003 | Forest bird; sensitive to winter temperature shifts impacting early-season foraging |
Prairie warbler | 1998 | Breeding success linked to warmer winters, which affect insect abundance and habitat quality |
Lake cress | 1898 | Wetland plant; warmer winters accelerate water loss and drying of wetlands, contributing to habitat degradation |
Broad-leaved puccoon | 1899 | Forest understory plant; warmer winters reduce dormancy survival and increase stress from habitat loss |
Nodding pogonia / three birds orchid | 1899 | Forest plant; warmer winters may disrupt flowering cycles and seedling survival |
Tinted spurge | 1901 | Prairie/forest species; warmer winters alter soil freeze-thaw cycles, affecting survival |
Black and gold bumble bee | 1930 | Pollinator; warmer winters can reduce overwintering survival and disrupt seasonal activity |
Round lake floater | 1930 | Freshwater mussel; warmer winters accelerate metabolic rates, increasing stress in altered wetlands |
Campeloma spire snail | 1932 | Aquatic snail; warmer winter waters amplify impacts of pollution and habitat loss |
Slippershell | 1936 | Freshwater mussel; reduced winter chilling affects reproduction and stream survival |
Rainbow | 1936 | Mussel species; warmer winter temperatures degrade habitat and increase predation risk |
Pink heelsplitter | 1936 | Freshwater mussel; warming winters reduce cold-water refugia in streams and wetlands |
Fawnsfoot | 1936 | Freshwater mussel; affected by both warmer winters and habitat destruction |
Bigmouth shiner | 1940 | Stream fish; warmer winters alter seasonal flows and reduce suitable cold-water habitats |
Furrowed flax | 1949 | Prairie/grassland plant; warmer winters may reduce seed survival and dormancy success |
Missouri rock-cress | 1950 | Prairie/rocky habitat plant; winter warming alters microhabitat conditions |
Spotted gar | 1956 | Wetland and river fish; warmer winters affect spawning cues and water temperatures |
Woodland goosefoot | 1961 | Forest/woodland plant; warmer winters increase stress and susceptibility to habitat change |
Trailing wild bean | 1961 | Forest understory plant; warmer winters disrupt dormancy and early growth |
Scirpus-like rush | 1983 | Wetland species; warmer winters reduce ice cover, affecting water levels and survival |
Purple spike rush | 1987 | Wetlands; warmer winters accelerate drying and habitat degradation |
Tall nut rush | 1987 | Wetlands; survival and reproduction impacted by warmer winter conditions |
Meadow beauty | 1988 | Prairie/wetland plant; altered winter conditions change soil moisture and nutrient availability |
Hall's bulrush | 1988 | Wetlands; warmer winters impact water levels and plant survival |
Few-flowered nut rush | 1988 | Wetlands; temperature-sensitive survival affected by milder winters |
Dune cutworm | 1989 | Sand dune insect; warmer winters reduce larval overwintering success |
Sprague's pygarctia | 1990 | Prairie moth; warmer winters disrupt pupal survival |
Pine katydid | 1991 | Pine forest specialist; winter warming affects egg survival and seasonal cycles |
Virginia water-horehound | 1994 | Wetland plant; warmer winters accelerate desiccation and habitat loss |
Blanchard's cricket frog | 1996 | Amphibian; warmer winters can increase winter mortality and disrupt breeding timing |
Kirtland's snake | 1996 | Prairie wetlands; warmer winters reduce hibernation survival and habitat suitability |
American goshawk | 2000 | Forest predator; winter warming indirectly affects prey populations |
Henslow's sparrow | 2002 | Prairie bird; survival influenced by milder winters altering cover and food availability |
Northern prostrate clubmoss | 2003 | Wetlands & forest understory plant; sensitive to temperature shifts in winter |
Deertoe | 2004 | River mussel; warmer winter water stress compounds habitat loss and poor water quality |
Paper pondshell | 2004 | Freshwater mussel; survival impacted by milder winters in combination with habitat destruction |
Tall green milkweed | 2005 | Prairies converted; warmer winters may affect seed dormancy and establishment |
Long-eared owl | 2005 | Forest predator; warmer winters affect prey abundance and hunting success |
Northern harrier | 2005 | Grassland & wetland bird; winter warming changes prey distribution and cover |
Black redhorse | 2005 | Riverine fish; warmer winter water temperatures affect growth and reproduction |
Eastern massasauga | 2005 | Wetland-dependent; warmer winters impact hibernation and wetland hydrology |
Umbrella-grass | 2006 | Wetland plant; milder winters reduce survival and water availability |
Cross-leaved milkwort | 2006 | Prairie/wetland plant; warmer winters alter soil moisture and dormancy |
Whorled mountain mint | 2006 | Grassland plant; winter warming may reduce seedling survival |
Grasshopper sparrow | 2007 | Prairie bird; winter warming affects cover and overwinter survival |
Tall meadowrue | 2007 | Wetland & prairie plant; survival impacted by milder winter stress |
Ginseng | 2010 | Forest understory; warmer winters reduce dormancy success and increase herbivory stress |
Downy sunflower | 2011 | Grassland plant; winter warming alters soil freezing cycles and seed survival |
Dwarf-bulrush | 2011 | Wetland plant; warmer winters affect water levels and plant persistence |
Northern appressed clubmoss | 2011 | Forest/wetland plant; milder winters reduce cold-dependent dormancy survival |
Virginia bluebells | 2011 | Forest wetlands; winter warming impacts timing of flowering and growth |
Queen snake | 2011 | Streamside/wetland snake; warmer winters affect hibernation and prey availability |
Bald-rush | 2011 | Wetlands; warmer winters exacerbate drying and survival stress |
Pitcher's thistle | 2013 | Dune plant; warmer winters reduce cold dormancy success and seedling survival |
Atlantic blue-eyed-grass | 2013 | Coastal wetlands; warmer winters alter water levels and cold stress |
Hill's thistle | 2014 | Prairie plant; winter warming affects dormancy and early growth |
Great Plains spittlebug | 2014 | Prairie insect; winter survival depends on minimum temperatures |
Climbing hempweed | 2014 | Wetland/prairie plant; warmer winters reduce cold survival and water-dependent habitats |
EMNT | Minimum Temperature |
EMXT | Maximum Temeprature |
TAVG | Average Temperature |
TMIN | Minimum Average Daily Temperature |
TMAX | Maximum Average Daily Temperature |
| [1] | Parmesan, C. 2003. “A Globally Coherent Fingerprint of Climate Change Impacts across Natural Systems.” Nature 421: 37–42. |
| [2] | Root, T. L., J. T. Price, K. R. Hall, S. H. Schneider, C. Rosenzweig, and J. A. Pounds. 2003. “Fingerprints of Global Warming on Wild Animals and Plants.” Nature 421: 57–60. |
| [3] | Hobbs, N. T., et al. 2016. “Climate Change Impacts on Wildlife Population Dynamics in North America.” Global Change Biology 22: 144–159. |
| [4] | Diffenbaugh, N., and C. Field. 2013. “Changes in Extreme Climate Events and Their Ecological Consequences.” Science 341: 486–491. |
| [5] | Swain, D. 2021. “Increasing Frequency of Extreme Precipitation in the Midwest.” Nature Climate Change 11: 256–263. |
| [6] | Winkler, J. A., et al. 2014. “Snowfall Decline and Winter Temperature Trends in the Great Lakes Region.” Climatic Change 124: 85–99. |
| [7] | Notaro, M., et al. 2014. “Projected Winter Warming and Snowpack Changes in the Great Lakes Basin.” Journal of Climate 27: 1837–1857. |
| [8] | Guentchev, G., et al. 2016. “Precipitation Variability and Ecological Stress in Midwestern Ecosystems.” Theoretical and Applied Climatology 126: 657–673. |
| [9] | Larson, M. 2014. “Winter Climate Effects on Northern Forest Raptors’ Reproduction and Survival.” The Auk 131: 57–68. |
| [10] | Urban, M. 2015. “Accelerating Extinction Risk from Climate Change.” Science 348: 571–573. |
| [11] | Cahill, A. E., T. K. Aiello-Lammens, M. A. Fisher-Reid, X. Hua, C. J. Karanewsky, H. Y. Ryu, G. C. Sbeglia, et al. 2013. “How Does Climate Change Cause Extinction?” Proceedings of the National Academy of Sciences 110: 8397–8402. |
| [12] | McCaffery, R., and B. Maxell. 2010. “Effects of Winter Climate on Amphibian Demography in the Northern U.S.” Copeia 2010: 45–53. |
| [13] | Van der Putten, W. H., et al. 2010. “Integrating Climate Change and Species Interactions in Biodiversity Forecasts.” Science 328: 629–632. |
| [14] | Bellard, C., C. Bertelsmeier, P. Leadley, W. Thuiller, and F. Courchamp. 2012. “Impacts of Climate Change on the Future of Biodiversity.” Ecology Letters 15: 365–377. |
| [15] | Zhang, Y., J. Wang, H. Li, and X. Chen. 2020. “Reconstructing Population Trajectories under Climatic Stressors Using KNN Modeling.” Ecological Modelling 431: 109256. |
| [16] | Mantyka-Pringle, C. S., J. S. Martin, and T. E. Davies. 2012. “Interactions between Climate Change and Habitat Loss Amplify Extinction Risk for Freshwater Species.” Conservation Biology 26: 323–333. |
| [17] | Sinclair, B. J., T. E. Williams, and D. L. Terblanche. 2016. “The Effects of Winter Snow and Minimum Temperature on Vertebrate Survival.” Global Change Biology 22: 1805–1818. |
| [18] | Peter, D. H., R. W. Wilson, and M. L. Jones. 2015. “Snowpack Decline Alters Predator–Prey Dynamics in Temperate Forests.” Ecology 96: 1456–1468. |
| [19] | Thackeray, S. J., et al. 2016. “Phenological Mismatches and Trophic Disruption under Climate Change.” Nature 531: 426–429. |
| [20] | Chen, I. C., J. K. Hill, R. Ohlemüller, D. B. Roy, and C. D. Thomas. 2011. “Rapid Range Shifts of Species Associated with High-Temperature Climatic Events.” Science 333: 1024–1026. |
| [21] | Bukaita, W., and A. Ghiurau. 2025. “The Impact of Climate Warming on Organism Populations in US.” International Journal of Environmental Monitoring and Analysis 13(4): 177–191. |
| [22] | National Centers for Environmental Information (NCEI). 2025. “Global Summary of the Month (GSOM).” |
| [23] | Michigan Natural Features Inventory. 2024. “Muskegon County Element Data.” |
| [24] |
Guillem SD. 2023. Global Daily Climate Data. Kaggle.
https://www.kaggle.com/datasets/guillemservera/global-daily-climate-data |
| [25] | Siepielski, A. M., M. B. Morrissey, M. Buoro, S. M. Carlson, C. M. Caruso, S. M. Clegg, et al. 2017. “Precipitation Drives Global Variation in Natural Selection.” Science 355(6328): 959–962. |
| [26] | Gordon, A. M., M. B. Youngquist, and M. D. Boone. 2016. “The Effects of Pond Drying and Predation on Blanchard’s Cricket Frogs (Acris blanchardi).” Copeia 104(2): 482–486. |
| [27] | Blakely, R. V., R. B. Siegel, E. B. Webb, C. P. Dillingham, M. Johnson, and D. C. Kesler. 2020. “Multi?scale Habitat Selection by Northern Goshawks (Accipiter gentilis) in a Fire?Prone Forest.” Biological Conservation 241: 108348. |
| [28] | Ratsch, Rikki, Bruce A. Kingsbury, and Mark A. Jordan. 2020. “Exploration of Environmental DNA (eDNA) to Detect Kirtland’s Snake (Clonophis kirtlandii).” Animals 10(6): 1057. |
| [29] | Hadad, E., J. Z. Kosicki, and R. Yosef. 2024. “Habitat Factors Driving Long?Eared Owl (Asio otus) Population Growth and Productivity in the Judea Region.” Journal of Raptor Research 58(1): 105–113. |
| [30] | Bukaita, Wisam. 2024. “Global Warming’s Influence on Temperature Increase.” In Proceedings of the Future Technologies Conference (FTC) 2024, Volume 3. Cham: Springer. |
| [31] | Bukaita, W., Anyaiwe, O. D., & Nelson, P. (2024). An analysis of temperature variability using an index model. In Proceedings of the Future Technologies Conference (FTC) 2024 (Vol. 3, pp. 291–306). Springer. |
APA Style
Bukaita, W., Ghiurau, A. (2025). Multivariate Climatic Drivers of Local Extirpation: Long-term Temperature, Snowfall, and Precipitation Dynamics in Michigan. International Journal of Environmental Monitoring and Analysis, 13(6), 328-346. https://doi.org/10.11648/j.ijema.20251306.14
ACS Style
Bukaita, W.; Ghiurau, A. Multivariate Climatic Drivers of Local Extirpation: Long-term Temperature, Snowfall, and Precipitation Dynamics in Michigan. Int. J. Environ. Monit. Anal. 2025, 13(6), 328-346. doi: 10.11648/j.ijema.20251306.14
AMA Style
Bukaita W, Ghiurau A. Multivariate Climatic Drivers of Local Extirpation: Long-term Temperature, Snowfall, and Precipitation Dynamics in Michigan. Int J Environ Monit Anal. 2025;13(6):328-346. doi: 10.11648/j.ijema.20251306.14
@article{10.11648/j.ijema.20251306.14,
  author = {Wisam Bukaita and Aaron Ghiurau},
  title = {Multivariate Climatic Drivers of Local Extirpation: Long-term Temperature, Snowfall, and Precipitation Dynamics in Michigan},
  journal = {International Journal of Environmental Monitoring and Analysis},
  volume = {13},
  number = {6},
  pages = {328-346},
  doi = {10.11648/j.ijema.20251306.14},
  url = {https://doi.org/10.11648/j.ijema.20251306.14},
  eprint = {https://article.sciencepublishinggroup.com/pdf/10.11648.j.ijema.20251306.14},
  abstract = {This study applies a multivariate climatic framework to evaluate how interacting long-term changes in minimum temperature, snowfall, and precipitation contribute to species decline and local extirpation in Michigan. We integrate 129 years of minimum temperature data, 64 years of precipitation records, and multi-decadal snowfall measurements with species-occurrence histories to quantify climatic pressures driving documented losses. The analysis shows a pronounced post-2000 rise in winter minimum temperatures marked by the near disappearance of extreme cold events (e.g., February minimums rising from –30°F to –9°F). These warmer minimum temperatures disrupt key ecological pathways by reducing the duration and intensity of cold-dependent physiological cues, increasing overwinter metabolic stress, and expanding predator and pathogen survival windows. Concurrent declines in January–February snowpack and the virtual loss of April snowfall further compound risk by diminishing the insulating snow layer essential for thermal buffering, hibernation stability, and protection of subnivean microhabitats. Precipitation patterns reveal increasing seasonal imbalance, with reduced summer rainfall and elevated spring and autumn precipitation, altering hydrological stability, breeding-site persistence, and seasonal habitat quality. To evaluate species responses, we develop synthetic K-Nearest Neighbors (KNN) population models for several climate-sensitive taxa-including Blanchard’s Cricket Frog, American Goshawk, Kirtland’s Snake, and the Long-eared Owl-which represent a novel integration of long-term multi-variable climate anomalies with data-driven population modeling. These models show coherent seasonal and interannual population declines that align with observed climatic anomalies, highlighting the combined effects of winter warming, snowpack loss, and altered moisture regimes on demographic resilience. A broader historical comparison further indicates a shift in the dominant drivers of biodiversity loss: whereas early extirpations were primarily linked to habitat conversion, recent and ongoing declines increasingly stem from the interaction of climatic warming with persistent habitat degradation. The findings demonstrate that no single climatic factor explains extirpation patterns; instead, vulnerability emerges from interacting climatic stressors that reshape overwintering conditions, hydrological cycles, and habitat suitability. By merging long-term climate datasets with synthetic KNN population modeling, this study advances tools for assessing climate-driven extinction risk and provides actionable insight for conservation planning in the Great Lakes region.},
 year = {2025}
}
TY  - JOUR
T1  - Multivariate Climatic Drivers of Local Extirpation: Long-term Temperature, Snowfall, and Precipitation Dynamics in Michigan
AU  - Wisam Bukaita
AU  - Aaron Ghiurau
Y1  - 2025/12/29
PY  - 2025
N1  - https://doi.org/10.11648/j.ijema.20251306.14
DO  - 10.11648/j.ijema.20251306.14
T2  - International Journal of Environmental Monitoring and Analysis
JF  - International Journal of Environmental Monitoring and Analysis
JO  - International Journal of Environmental Monitoring and Analysis
SP  - 328
EP  - 346
PB  - Science Publishing Group
SN  - 2328-7667
UR  - https://doi.org/10.11648/j.ijema.20251306.14
AB  - This study applies a multivariate climatic framework to evaluate how interacting long-term changes in minimum temperature, snowfall, and precipitation contribute to species decline and local extirpation in Michigan. We integrate 129 years of minimum temperature data, 64 years of precipitation records, and multi-decadal snowfall measurements with species-occurrence histories to quantify climatic pressures driving documented losses. The analysis shows a pronounced post-2000 rise in winter minimum temperatures marked by the near disappearance of extreme cold events (e.g., February minimums rising from –30°F to –9°F). These warmer minimum temperatures disrupt key ecological pathways by reducing the duration and intensity of cold-dependent physiological cues, increasing overwinter metabolic stress, and expanding predator and pathogen survival windows. Concurrent declines in January–February snowpack and the virtual loss of April snowfall further compound risk by diminishing the insulating snow layer essential for thermal buffering, hibernation stability, and protection of subnivean microhabitats. Precipitation patterns reveal increasing seasonal imbalance, with reduced summer rainfall and elevated spring and autumn precipitation, altering hydrological stability, breeding-site persistence, and seasonal habitat quality. To evaluate species responses, we develop synthetic K-Nearest Neighbors (KNN) population models for several climate-sensitive taxa-including Blanchard’s Cricket Frog, American Goshawk, Kirtland’s Snake, and the Long-eared Owl-which represent a novel integration of long-term multi-variable climate anomalies with data-driven population modeling. These models show coherent seasonal and interannual population declines that align with observed climatic anomalies, highlighting the combined effects of winter warming, snowpack loss, and altered moisture regimes on demographic resilience. A broader historical comparison further indicates a shift in the dominant drivers of biodiversity loss: whereas early extirpations were primarily linked to habitat conversion, recent and ongoing declines increasingly stem from the interaction of climatic warming with persistent habitat degradation. The findings demonstrate that no single climatic factor explains extirpation patterns; instead, vulnerability emerges from interacting climatic stressors that reshape overwintering conditions, hydrological cycles, and habitat suitability. By merging long-term climate datasets with synthetic KNN population modeling, this study advances tools for assessing climate-driven extinction risk and provides actionable insight for conservation planning in the Great Lakes region.
VL  - 13
IS  - 6
ER  -
Math and Computer Science Department, Lawrence Technological University, Southfield, The United States
Math and Computer Science Department, Lawrence Technological University, Southfield, The United States
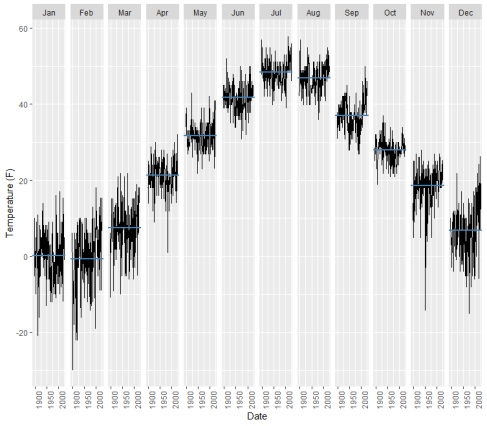
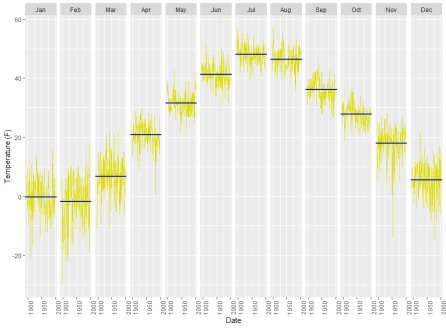
Figure 2. Minimum Monthly Temperature and Pre-2000 Mean Baseline.
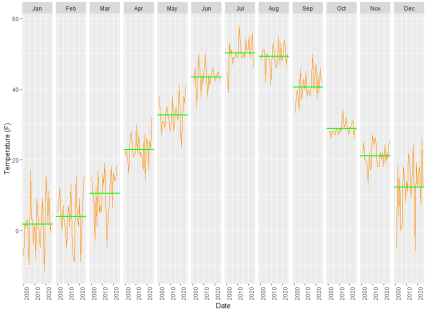
Figure 3. Minimum Monthly Temperature and Post-2000 Mean Baseline.
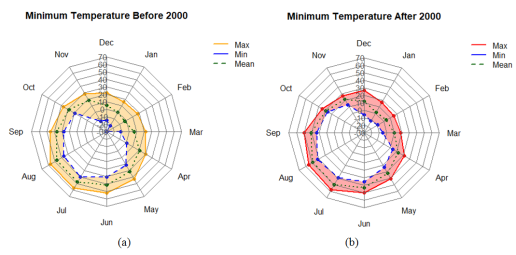
Figure 4. Comparison of Minimum Temperatures pre-2000 and post-2000.
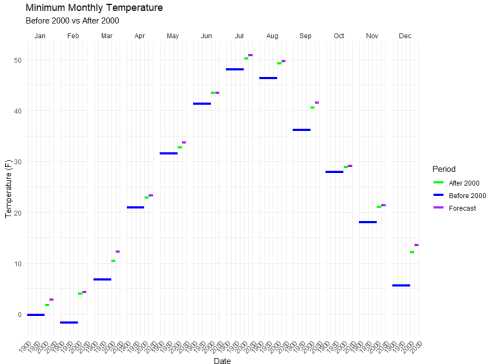
Figure 5. Observed and Forecasted Mean Monthly Minimum Temperatures: Pre-2000, Post-2000, and 2025–2050.
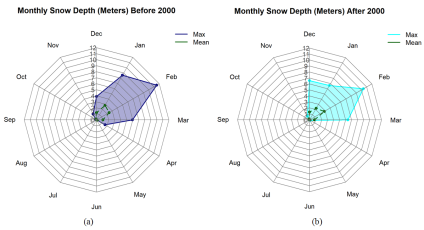
Figure 6. Comparison of Monthly Snow Depth pre-2000 and post-2000.
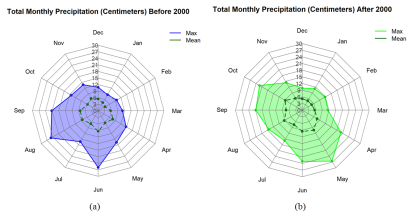
Figure 7. Comparison of Monthly Precipitation pre-2000 and post-2000.
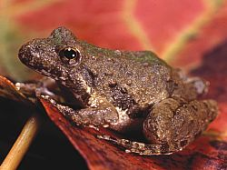
Figure 8. Blanchard’s Cricket Frog (Acris blanchardi) [26].
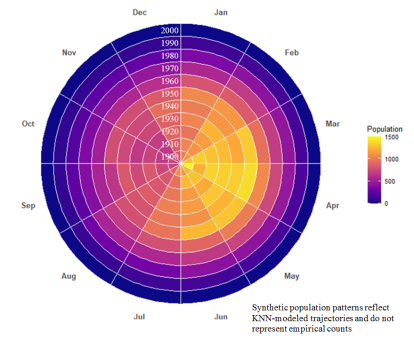
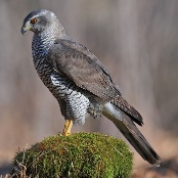
Figure 10. American Goshawk [27].
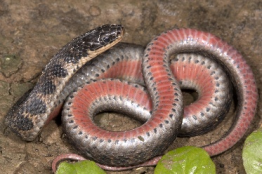
Figure 12. Kirtland’s Snake [28].
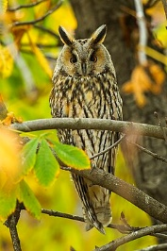
Figure 14. Long-eared Owl [29].