One of the major sources of tropospheric ozone (O3) precursors such as nitrogen oxides (NOx), carbon monoxides (CO), and non-methane volatile organic compounds (NMVOCs) is biomass burning. The emissions from the burning not only affect air quality and climate locally, but also on a continental to hemispheric scales through long-range transport. We used NASA’s Global Modeling Initiative Chemistry and Transport Model (GMI-CTM), to quantify the changes in surface ozone over Northern Sub-Saharan Africa (NSSA: 0 – 20N, 20W – 55E), as triggered by biomass burning from different regions. During the winter months (i.e., January), most of the burning is concentrated in the NSSA region while in summer it shifts southward outside the NSSA region. Our analysis reveals that out of the total contribution to surface ozone from biomass burning emissions in the NSSA region, 92% is due to NSSA biomass burning while the remaining 8% is from outside the NSSA. In fact, most (~75%) of the 8% comes from outside the African continent because little to no biomass burning occurs in Africa outside of the NSSA region during this time of year. However, during the summer months (i.e., July), most of the contribution to NSSA surface ozone (96%) is due to burning from outside NSSA. Only 10% of the 96% comes from outside the African continent because during this time most of the burning is from outside the NSSA but within the African continent. In spring (i.e., April) approximately equal percentages of contributions come from within and outside the NSSA region.
| Published in | International Journal of Environmental Monitoring and Analysis (Volume 14, Issue 1) |
| DOI | 10.11648/j.ijema.20261401.13 |
| Page(s) | 17-30 |
| Creative Commons |
This is an Open Access article, distributed under the terms of the Creative Commons Attribution 4.0 International License (http://creativecommons.org/licenses/by/4.0/), which permits unrestricted use, distribution and reproduction in any medium or format, provided the original work is properly cited. |
| Copyright |
Copyright © The Author(s), 2026. Published by Science Publishing Group |
Air Quality, Biomass Burning, Surface Ozone, Northern Sub-Saharan Africa, Chemistry and Transport Model
GLOBAL / Tg | AFRICA / Tg | NSSA / Tg | |
|---|---|---|---|
CO | 561 | 250.3 | 84.3 |
CH2O | 10.6 | 4.3 | 1.45 |
CH4 | 27.6 | 9.7 | 3.32 |
CH4O | 15.6 | 6.4 | 2.19 |
CO2 | 12400 | 6240 | 2100 |
NOX | 19.0 | 9.4 | 3.18 |
OC | 27.3 | 12.3 | 4.16 |
BC | 3.6 | 1.7 | 0.60 |
VOC | 46.7 | 21.0 | 7.13 |
O3 | Ozone |
NO2 | Nitrogen Oxide |
CO | Carbon Monoxides |
NMVOC | Non-Methane Volatile Organic Compounds |
GMI | Global Modeling Initiative |
CTM | Chemistry and Transport Model |
NSSA | Northern Sub-Saharan Africa |
SHA | Southern-Hemisphere Africa |
MODIS | Moderate Resolution Imaging Spectroradiometer |
GMAO | Global Modeling and Assimilation Office |
GFED | Global Fire Emissions Database |
ITCZ | Intertropical Convergence Zone |
BB | Biomass Burning |
ppbv | Parts Per Billion by Volume |
WHO | World Health Organization |
ECOWAS | Economic Community of West African States |
EAC | East African Community |
SADC | Southern African Development Community |
AMMA | African Monsoon Multidisciplinary Analysis |
DACCIWA | Dynamics-Aerosol-Chemistry-Cloud Interactions in West Africa |
NASA | National Aeronautics and Space Administration |
| [1] | Aghedo, A. M., Schultz, M. G., and Rast, S. (2007). The influence of African air pollution on regional and global tropospheric ozone. Atmospheric Chemistry and Physics, 7(5), 1193-1212. |
| [2] | Ainsworth, E. A., Yendrek, C. R., Sitch, S., Collins, W. J., and Emberson, L. D. (2012). The effects of tropospheric ozone on net primary productivity and implications for climate change. Annual Review of Plant Biology, 63, 637-661. |
| [3] | Akagi, S. K., Yokelson, R. J., Wiedinmyer, C., Alvarado, M. J., Reid, J. S., Karl, T., Crounse, J. D., and Wennberg, P. O. (2011). Emission factors for open and domestic biomass burning for use in atmospheric models. Atmospheric Chemistry and Physics, 11(9), 4039-4072. |
| [4] | Andreae, M. O. and Merlet, P. (2001). Emission of trace gases and aerosols from biomass burning. Global Biogeochemical Cycles, 15(4), 955-966. |
| [5] | Archibald, A. T., Jenkin, M. E., and Shallcross, D. E. (2010). An isoprene mechanism intercomparison. Atmospheric Environment, 44(40), 5356-5364. |
| [6] | Bell, M. L., Peng, R. D., and Dominici, F. (2006). The exposure-response curve for ozone and risk of mortality and the adequacy of current ozone regulations. Environmental Health Perspectives, 114(4), 532-536. |
| [7] | Bond, T. C., Doherty, S. J., Fahey, D. W., Forster, P. M., Berntsen, T., DeAngelo, B. J., Flanner, M. G., Ghan, S., Kärcher, B., Koch, D., Kinne, S., Kondo, Y., Quinn, P. K., Sarofim, M. C., Schultz, M. G., Schulz, M., Venkataraman, C., Zhang, H., Zhang, S., Bellouin, N., Guttikunda, S. K., Hopke, P. K., Jacobson, M. Z., Kaiser, J. W., Klimont, Z., Lohmann, U., Schwarz, J. P., Shindell, D., Storelvmo, T., Warren, S. G., and Zender, C. S. (2013). Bounding the role of black carbon in the climate system: A scientific assessment. Journal of Geophysical Research: Atmospheres, 118(11), 5380-5552. |
| [8] | Chatfield, R. B., Vastano, J. A., Singh, H. B., and Sachse, G. (1998). A general model of how fire emissions and chemistry produce African/oceanic plumes (O₃, CO, PAN, smoke) in TRACE A. Journal of Geophysical Research: Atmospheres, 103(D15), 19059-19080. |
| [9] | Crutzen, P. J. and Andreae, M. O. (1990). Biomass burning in the tropics: Impact on atmospheric chemistry and biogeochemical cycles. Science, 250(4988), 1669-1678. |
| [10] | Damoah, R., Spichtinger, N., Forster, C., James, P., Mattis, I., Wandinger, U.,... & Stohl, A. (2004). Around the world in 17 days-hemispheric-scale transport of forest fire smoke from Russia in May 2003. Atmospheric Chemistry and Physics, 4(5), 1311-1321. |
| [11] | Damoah, R., Spichtinger, N., Servranckx, R., Fromm, M., Eloranta, E. W., Razenkov, I. A.,... & Stohl, A. (2006). A case study of pyro-convection using transport model and remote sensing data. Atmospheric Chemistry and Physics, 6(1), 173-185. |
| [12] | Duncan, B. N., Logan, J. A., Bey, I., Megretskaia, I. A., Yantosca, R. M., Novelli, P. C., Jones, N. B., and Rinsland, C. P. (2003). Global budget of CO, 1988-1997: Source estimates and validation with a global model. Journal of Geophysical Research: Atmospheres, 108(D20), 4581. |
| [13] | Duncan, B. N., West, J. J., Yoshida, Y., Fiore, A. M., and Ziemke, J. R. (2008). The influence of European pollution on ozone in the Near East and northern Africa. Atmospheric Chemistry and Physics, 8(8), 2267-2283. |
| [14] | Duncan, B. N., Strahan, S. E., Yoshida, Y., Steenrod, S. D., and Livesey, N. (2007). Model study of the cross-tropopause transport of biomass burning pollution. Atmospheric Chemistry and Physics, 7(14), 3713-3736. |
| [15] | Edwards, D. P., Emmons, L. K., Hauglustaine, D. A., Chu, D. A., Gille, J. C., Kaufman, Y. J., Pétron, G., Yurganov, L. N., Giglio, L., Deeter, M. N., Yudin, V., Ziskin, D. C., Warner, J., Lamarque, J. F., Francis, G. L., Ho, S. P., Mao, D., Chen, J., Grechko, E. I., and Drummond, J. R. (2006). Observations of carbon monoxide and aerosols from the Terra satellite: Northern Hemisphere variability. Journal of Geophysical Research: Atmospheres, 111(D24), D24306. |
| [16] | Emmerson, K. M. and Evans, M. J. (2009). Comparison of tropospheric gas-phase chemistry schemes for use within global models. Atmospheric Chemistry and Physics, 9(5), 1831-1845. |
| [17] | Fiore, A. M., Dentener, F. J., Wild, O., Cuvelier, C., Schultz, M. G., Hess, P., Textor, C., Schulz, M., Doherty, R. M., Horowitz, L. W., MacKenzie, I. A., Sanderson, M. G., Shindell, D. T., Stevenson, D. S., Szopa, S., Van Dingenen, R., Zeng, G., Atherton, C., Bergmann, D., Bey, I., Carmichael, G., Collins, W. J., Duncan, B. N., Faluvegi, G., Folberth, G., Gauss, M., Gong, S., Hauglustaine, D., Holloway, T., Isaksen, I. S. A., Jacob, D. J., Jonson, J. E., Kaminski, J. W., Keating, T. J., Lupu, A., Marmer, E., Montanaro, V., Park, R. J., Pitari, G., Pringle, K. J., Pyle, J. A., Schroeder, S., Vivanco, M. G., Wind, P., Wojcik, G., Wu, S., and Zuber, A. (2009). Multimodel estimates of intercontinental source-receptor relationships for ozone pollution. Journal of Geophysical Research: Atmospheres, 114(D4), D04301. |
| [18] | Fiscus, E. L., Booker, F. L., and Burkey, K. O. (2005). Crop responses to ozone: uptake, modes of action, carbon assimilation and partitioning. Plant, Cell & Environment, 28(8), 997-1011. |
| [19] | Fleming, Z. L., Doherty, R. M., von Schneidemesser, E., Malley, C. S., Cooper, O. R., Pinto, J. P., Colette, A., Xu, X., Simpson, D., Schultz, M. G., Lefohn, A. S., Hamad, S., Moolla, R., Solberg, S., and Feng, Z. (2018). Tropospheric Ozone Assessment Report: Present-day ozone distribution and trends relevant to human health. Elementa: Science of the Anthropocene, 6(1), 12. |
| [20] | Freitas, S. R., Longo, K. M., Chatfield, R., Latham, D., Silva Dias, M. A. F., Andreae, M. O., Prins, E., Santos, J. C., Gielow, R., and Carvalho Jr, J. A. (2007). Including the sub-grid scale plume rise of vegetation fires in low resolution atmospheric transport models. Atmospheric Chemistry and Physics, 7(13), 3385-3398. |
| [21] | Fromm, M., Bevilacqua, R., Servranckx, R., Rosen, J., Thayer, J. P., Herman, J., and Larko, D. (2005). Pyro-cumulonimbus injection of smoke to the stratosphere: Observations and impact of a super blowup in northwestern Canada on 3–4 August 1998. Journal of Geophysical Research: Atmospheres, 110(D8), D08205. |
| [22] | Garstang, M., Tyson, P. D., Swap, R., Edwards, M., Kållberg, P., and Lindesay, J. A. (1996). Horizontal and vertical transport of air over southern Africa. Journal of Geophysical Research: Atmospheres, 101(D19), 23721-23736. |
| [23] | Giglio, L., Randerson, J. T., and van der Werf, G. R. (2013). Analysis of daily, monthly, and annual burned area using the fourth-generation global fire emissions database (GFED4). Journal of Geophysical Research: Biogeosciences, 118(1), 317-328. |
| [24] | Giglio, L., Csiszar, I., and Justice, C. O. (2006). Global distribution and seasonality of active fires as observed with the Terra and Aqua Moderate Resolution Imaging Spectroradiometer (MODIS) sensors. Journal of Geophysical Research: Biogeosciences, 111(G2), G02016. |
| [25] | Jacob, D. J., Logan, J. A., Gardner, G. M., Yevich, R. M., Spivakovsky, C. M., Wofsy, S. C., Sillman, S., and Prather, M. J. (1996). Factors regulating ozone over the United States and its export to the global atmosphere. Journal of Geophysical Research: Atmospheres, 98(D8), 14817-14826. |
| [26] | Jerrett, M., Burnett, R. T., Pope III, C. A., Ito, K., Thurston, G., Krewski, D., Shi, Y., Calle, E., and Thun, M. (2009). Long-term ozone exposure and mortality. New England Journal of Medicine, 360(11), 1085-1095. |
| [27] | Justice, C. O., Giglio, L., Korontzi, S., Owens, J., Morisette, J. T., Roy, D. & Kaufman, Y. (2002). The MODIS fire products. Remote sensing of Environment, 83(1-2), 244-262. |
| [28] | Kaiser, J. W., Heil, A., Andreae, M. O., Benedetti, A., Chubarova, N., Jones, L., Morcrette, J. J., Razinger, M., Schultz, M. G., Suttie, M., and van der Werf, G. R. (2012). Biomass burning emissions estimated with a global fire assimilation system based on observed fire radiative power. Biogeosciences, 9(1), 527-554. |
| [29] | Knippertz, P., Coe, H., Chiu, J. C., Evans, M. J., Fink, A. H., Kalthoff, N., Liousse, C., Mari, C., Allan, R. P., Brooks, B., Danour, S., Flamant, C., Jegede, O. O., Lohou, F., and Marsham, J. H. (2015). The DACCIWA project: Dynamics-aerosol-chemistry-cloud interactions in West Africa. Bulletin of the American Meteorological Society, 96(9), 1451-1460. |
| [30] | Lelieveld, J., Evans, J. S., Fnais, M., Giannadaki, D., and Pozzer, A. (2015). The contribution of outdoor air pollution sources to premature mortality on a global scale. Nature, 525(7569), 367-371. |
| [31] | Liang, Q., Jaeglé, L., Jaffe, D. A., Weiss-Penzias, P., Heckman, A., and Snow, J. A. (2004). Long-range transport of Asian pollution to the northeast Pacific: Seasonal variations and transport pathways of carbon monoxide. Journal of Geophysical Research: Atmospheres, 109(D23), D23S07. |
| [32] | Liousse, C., Assamoi, E., Criqui, P., Granier, C., and Rosset, R. (2014). Explosive growth in African combustion emissions from 2005 to 2030. Environmental Research Letters, 9(3), 035003. |
| [33] | Lippmann, M. (1989). Health effects of ozone: A critical review. JAPCA, 39(5), 672-695. |
| [34] | Liu, H., Jacob, D. J., Bey, I., and Yantosca, R. M. (2001). Constraints from ²¹⁰Pb and ⁷Be on wet deposition and transport in a global three-dimensional chemical tracer model driven by assimilated meteorological fields. Journal of Geophysical Research: Atmospheres, 106(D11), 12109-12128. |
| [35] | Machete, R. L., & Dintwe, K. (2023). Cyclic trends of wildfires over sub-saharan africa. Fire, 6(2), 71. |
| [36] | Marais, E. A. and Wiedinmyer, C. (2016). Air quality impact of diffuse and inefficient combustion emissions in Africa (DICE-Africa). Environmental Science & Technology, 50(19), 10739-10745. |
| [37] | Mari, C., Jacob, D. J., and Bechtold, P. (2000). Transport and scavenging of soluble gases in a deep convective cloud. Journal of Geophysical Research: Atmospheres, 105(D17), 22255-22267. |
| [38] | Mari, C. H., Cailley, G., Corre, L., Saunois, M., Attié, J. L., Thouret, V., and Stohl, A. (2008). Tracing biomass burning plumes from the Southern Hemisphere during the AMMA 2006 wet season experiment. Atmospheric Chemistry and Physics, 8(14), 3951-3961. |
| [39] | Mbow, C., Nielsen, T. T., and Rasmussen, K. (2004). Savanna fires in east-central Senegal: distribution patterns, resource management and perceptions. Human Ecology, 32(5), 561-583. |
| [40] | Mills, G., Buse, A., Gimeno, B., Bermejo, V., Holland, M., Emberson, L., and Pleijel, H. (2007). A synthesis of AOT40-based response functions and critical levels of ozone for agricultural and horticultural crops. Atmospheric Environment, 41(12), 2630-2643. |
| [41] | Monks, P. S., Archibald, A. T., Colette, A., Cooper, O., Coyle, M., Derwent, R., Fowler, D., Granier, C., Law, K. S., Mills, G. E., Stevenson, D. S., Tarasova, O., Thouret, V., von Schneidemesser, E., Sommariva, R., Wild, O., and Williams, M. L. (2015). Tropospheric ozone and its precursors from the urban to the global scale from air quality to short-lived climate forcer. Atmospheric Chemistry and Physics, 15(15), 8889-8973. |
| [42] | Olson, D. M., Dinerstein, E., Wikramanayake, E. D., Burgess, N. D., Powell, G. V., Underwood, E. C., D'amico, J. A., Itoua, I., Strand, H. E., Morrison, J. C., Loucks, C. J., Allnutt, T. F., Ricketts, T. H., Kura, Y., Lamoreux, J. F., Wettengel, W. W., Hedao, P., and Kassem, K. R. (2001). Terrestrial Ecoregions of the World: A New Map of Life on Earth: A new global map of terrestrial ecoregions provides an innovative tool for conserving biodiversity. BioScience, 51(11), 933-938. |
| [43] | Ott, L. E., Pickering, K. E., Stenchikov, G. L., Allen, D. J., DeCaria, A. J., Ridley, B., Lin, R. F., Lang, S., and Tao, W. K. (2010). Production of lightning NOₓ and its vertical distribution calculated from three-dimensional cloud-scale chemical transport model simulations. Journal of Geophysical Research: Atmospheres, 115(D4), D04301. |
| [44] | Rienecker, M. M., Suarez, M. J., Gelaro, R., Todling, R., Bacmeister, J., Liu, E., Bosilovich, M. G., Schubert, S. D., Takacs, L., Kim, G. K., Bloom, S., Chen, J., Collins, D., Conaty, A., da Silva, A., Gu, W., Joiner, J., Koster, R. D., Lucchesi, R., Molod, A., Owens, T., Pawson, S., Pegion, P., Redder, C. R., Reichle, R., Robertson, F. R., Ruddick, A. G., Sienkiewicz, M., and Woollen, J. (2011). MERRA: NASA's modern-era retrospective analysis for research and applications. Journal of Climate, 24(14), 3624-3648. |
| [45] | Roberts, G., Wooster, M. J., and Lagoudakis, E. (2009). Annual and diurnal african biomass burning temporal dynamics. Biogeosciences, 6(5), 849-866. |
| [46] | Sauvage, B., Thouret, V., Cammas, J. P., Gheusi, F., Athier, G., and Nédélec, P. (2005). Tropospheric ozone over Equatorial Africa: regional aspects from the MOZAIC data. Atmospheric Chemistry and Physics, 5(2), 311-335. |
| [47] | Scholes, R. J., Archibald, S., and von Maltitz, G. (2011). Emissions from fire in sub-Saharan Africa: the magnitude of sources, their variability and uncertainty. In Ecosystem Function in Savannas: Measurement and Modeling at Landscape to Global Scales (pp. 457-471). CRC Press. |
| [48] | Silva, R. A., West, J. J., Zhang, Y., Anenberg, S. C., Lamarque, J. F., Shindell, D. T., Collins, W. J., Dalsoren, S., Faluvegi, G., Folberth, G., Horowitz, L. W., Nagashima, T., Naik, V., Rumbold, S., Skeie, R., Sudo, K., Takemura, T., Bergmann, D., Cameron-Smith, P., Cionni, I., Doherty, R. M., Eyring, V., Josse, B., MacKenzie, I. A., Plummer, D., Righi, M., Stevenson, D. S., Strode, S., Szopa, S., and Zeng, G. (2013). Global premature mortality due to anthropogenic outdoor air pollution and the contribution of past climate change. Environmental Research Letters, 8(3), 034005. |
| [49] | Sillman, S. (1999). The relation between ozone, NOₓ and hydrocarbons in urban and polluted rural environments. Atmospheric Environment, 33(12), 1821-1845. |
| [50] | Sitch, S., Cox, P. M., Collins, W. J., and Huntingford, C. (2007). Indirect radiative forcing of climate change through ozone effects on the land-carbon sink. Nature, 448(7155), 791-794. |
| [51] | Stevenson, D. S., Dentener, F. J., Schultz, M. G., Ellingsen, K., van Noije, T. P. C., Wild, O., Zeng, G., Amann, M., Atherton, C. S., Bell, N., Bergmann, D. J., Bey, I., Butler, T., Cofala, J., Collins, W. J., Derwent, R. G., Doherty, R. M., Drevet, J., Eskes, H. J., Fiore, A. M., Gauss, M., Hauglustaine, D. A., Horowitz, L. W., Isaksen, I. S. A., Krol, M. C., Lamarque, J. F., Lawrence, M. G., Montanaro, V., Müller, J. F., Pitari, G., Prather, M. J., Pyle, J. A., Rast, S., Rodriguez, J. M., Sanderson, M. G., Savage, N. H., Shindell, D. T., Strahan, S. E., Sudo, K., and Szopa, S. (2006). Multimodel ensemble simulations of present-day and near-future tropospheric ozone. Journal of Geophysical Research: Atmospheres, 111(D8), D08301. |
| [52] | Stohl, A., Eckhardt, S., Forster, C., James, P., Spichtinger, N., and Seibert, P. (2002). A replacement for simple back trajectory calculations in the interpretation of atmospheric trace substance measurements. Atmospheric Environment, 36(29), 4635-4648. |
| [53] | Strahan, S. E., Duncan, B. N., and Hoor, P. (2007). Observationally derived transport diagnostics for the lowermost stratosphere and their application to the GMI chemistry and transport model. Atmospheric Chemistry and Physics, 7(9), 2435-2445. |
| [54] | Swap, R. J., Annegarn, H. J., Suttles, J. T., King, M. D., Platnick, S., Privette, J. L., and Scholes, R. J. (2003). Africa burning: A thematic analysis of the Southern African Regional Science Initiative (SAFARI 2000). Journal of Geophysical Research: Atmospheres, 108(D13), 8465. |
| [55] | Thompson, A. M., Pickering, K. E., McNamara, D. P., Schoeberl, M. R., Hudson, R. D., Kim, J. H., Browell, E. V., Kirchhoff, V. W. J. H., and Nganga, D. (1996). Where did tropospheric ozone over southern Africa and the tropical Atlantic come from in October 1992? Insights from TOMS, GTE TRACE A, and SAFARI 1992. Journal of Geophysical Research: Atmospheres, 101(D19), 24251-24278. |
| [56] | Thompson, A. M., Witte, J. C., McPeters, R. D., Oltmans, S. J., Schmidlin, F. J., Logan, J. A., Fujiwara, M., Kirchhoff, V. W. J. H., Posny, F., Coetzee, G. J. R., Hoegger, B., Kawakami, S., Ogawa, T., Johnson, B. J., Vömel, H., and Labow, G. (2003). Southern Hemisphere Additional Ozonesondes (SHADOZ) 1998–2000 tropical ozone climatology 1. Comparison with Total Ozone Mapping Spectrometer (TOMS) and ground-based measurements. Journal of Geophysical Research: Atmospheres, 108(D2), 8238. |
| [57] | Thompson, A. M., Doddridge, B. G., Witte, J. C., Hudson, R. D., Luke, W. T., Johnson, J. E., Johnson, B. J., Oltmans, S. J., and Weller, R. (2000). A tropical Atlantic paradox: Shipboard and satellite views of a tropospheric ozone maximum and wave-one in January-February 1999. Geophysical Research Letters, 27(20), 3317-3320. |
| [58] | Thompson, A. M., Oltmans, S. J., Tarasick, D. W., Von Der Gathen, P., Smit, H. G. J., and Witte, J. C. (2011). Strategic ozone sounding networks: Review of design and accomplishments. Atmospheric Environment, 45(13), 2145-2163. |
| [59] | Tie, X., Madronich, S., Walters, S., Edwards, D. P., Ginoux, P., Mahowald, N., Zhang, R., Lou, C., and Brasseur, G. (2003). Assessment of the global impact of aerosols on tropospheric oxidants. Journal of Geophysical Research: Atmospheres, 108(D3), 4 318. |
| [60] | van der Werf, G. R., Randerson, J. T., Giglio, L., Collatz, G. J., Kasibhatla, P. S., and Arellano Jr, A. F. (2006). Interannual variability in global biomass burning emissions from 1997 to 2004. Atmospheric Chemistry and Physics, 6(11), 3423-3441. |
| [61] | van der Werf, G. R., Randerson, J. T., Giglio, L., Collatz, G. J., Mu, M., Kasibhatla, P. S., Morton, D. C., DeFries, R. S., Jin, Y., and van Leeuwen, T. T. (2010). Global fire emissions and the contribution of deforestation, savanna, forest, agricultural, and peat fires (1997–2009). Atmospheric Chemistry and Physics, 10(23), 11707-11735. |
| [62] | van der Werf, G. R., Randerson, J. T., Giglio, L., van Leeuwen, T. T., Chen, Y., Rogers, B. M., Mu, M., van Marle, M. J. E., Morton, D. C., Collatz, G. J., Yokelson, R. J., and Kasibhatla, P. S. (2017). Global fire emissions estimates during 1997–2016. Earth System Science Data, 9(2), 697-720. |
| [63] | WHO (World Health Organization) (2006). WHO Air quality guidelines for particulate matter, ozone, nitrogen dioxide and sulfur dioxide: Global update 2005. World Health Organization, Geneva, Switzerland. |
| [64] | Wild, O. and Akimoto, H. (2001). Intercontinental transport of ozone and its precursors in a three-dimensional global CTM. Journal of Geophysical Research: Atmospheres, 106(D21), 27729-27744. |
| [65] | Wild, O., Fiore, A. M., Shindell, D. T., Doherty, R. M., Collins, W. J., Dentener, F. J., Schultz, M. G., Gong, S., MacKenzie, I. A., Zeng, G., Hess, P., Duncan, B. N., Bergmann, D. J., Szopa, S., Jonson, J. E., Keating, T. J., and Zuber, A. (2012). Modelling future changes in surface ozone: a parameterized approach. Atmospheric Chemistry and Physics, 12(4), 2037-2054. |
| [66] | Wooster, M. J., Roberts, G., Perry, G. L. W., and Kaufman, Y. J. (2005). Retrieval of biomass combustion rates and totals from fire radiative power observations: FRP derivation and calibration relationships between biomass consumption and fire radiative energy release. Journal of Geophysical Research: Atmospheres, 110(D24), D24311. |
| [67] | Wooster, M. J., Perry, G. L. W., and Zoumas, A. (2012). Fire, drought and El Niño relationships on Borneo (Southeast Asia) in the pre-MODIS era (1980-2000). Biogeosciences, 9(1), 317-340. |
| [68] | Wotawa, G. and Trainer, M.: The influence of Canadian forest fires on pollutant concentrations in the United States, Science, 288, 324–328, 2000. |
| [69] | Yevich, R. and Logan, J. A. (2003). An assessment of biofuel use and burning of agricultural waste in the developing world. Global Biogeochemical Cycles, 17(4), 1095. |
| [70] | Yonemura, S., Kawashima, S., and Tsuruta, H. (2014). Carbon monoxide, hydrogen, and methane uptake by soils in a temperate arable field and a forest. Journal of Geophysical Research: Atmospheres, 105(D11), 14347-14362. |
| [71] | Ziemke, J. R., Chandra, S., Duncan, B. N., Froidevaux, L., Bhartia, P. K., Levelt, P. F., and Waters, J. W. (2006). Tropospheric ozone determined from Aura OMI and MLS: Evaluation of measurements and comparison with the Global Modeling Initiative's Chemical Transport Model. Journal of Geophysical Research: Atmospheres, 111(D19), D19303. |
| [72] | Wild, O., & Prather, M. J. (2006), Global tropospheric ozone modeling: Quantifying errors due to grid resolution, Journal of Geophysical Research: Atmospheres, 111(D11), D11305. |
| [73] | Strahan, S. E., & Douglass, A. R. (2004), Evaluating the credibility of transport processes in simulations of ozone recovery using the Global Modeling Initiative three-dimensional model. Journal of Geophysical Research: Atmospheres, 109(D05), D05110. |
| [74] | Douglass, A. R., Stolarski, R. S., Strahan, S. E., & Connell, P. S. (2004), Radicals and reservoirs in the GMI chemistry and transport model: Comparison to measurements. Journal of Geophysical Research: Atmospheres, 109(D16), D16302. |
APA Style
Damoah, R., Li, X., Ibebuchi, C. C., Fosu-Amankwah, K., Asare, K. (2026). Quantifying Contributions of Biomass Burning to Air Quality in Africa. International Journal of Environmental Monitoring and Analysis, 14(1), 17-30. https://doi.org/10.11648/j.ijema.20261401.13
ACS Style
Damoah, R.; Li, X.; Ibebuchi, C. C.; Fosu-Amankwah, K.; Asare, K. Quantifying Contributions of Biomass Burning to Air Quality in Africa. Int. J. Environ. Monit. Anal. 2026, 14(1), 17-30. doi: 10.11648/j.ijema.20261401.13
AMA Style
Damoah R, Li X, Ibebuchi CC, Fosu-Amankwah K, Asare K. Quantifying Contributions of Biomass Burning to Air Quality in Africa. Int J Environ Monit Anal. 2026;14(1):17-30. doi: 10.11648/j.ijema.20261401.13
@article{10.11648/j.ijema.20261401.13,
  author = {Richard Damoah and Xiaowen Li and Chibuike Chiedozie Ibebuchi and Kwabena Fosu-Amankwah and Kofi Asare},
  title = {Quantifying Contributions of Biomass Burning to Air Quality in Africa},
  journal = {International Journal of Environmental Monitoring and Analysis},
  volume = {14},
  number = {1},
  pages = {17-30},
  doi = {10.11648/j.ijema.20261401.13},
  url = {https://doi.org/10.11648/j.ijema.20261401.13},
  eprint = {https://article.sciencepublishinggroup.com/pdf/10.11648.j.ijema.20261401.13},
  abstract = {One of the major sources of tropospheric ozone (O3) precursors such as nitrogen oxides (NOx), carbon monoxides (CO), and non-methane volatile organic compounds (NMVOCs) is biomass burning. The emissions from the burning not only affect air quality and climate locally, but also on a continental to hemispheric scales through long-range transport. We used NASA’s Global Modeling Initiative Chemistry and Transport Model (GMI-CTM), to quantify the changes in surface ozone over Northern Sub-Saharan Africa (NSSA: 0 – 20N, 20W – 55E), as triggered by biomass burning from different regions. During the winter months (i.e., January), most of the burning is concentrated in the NSSA region while in summer it shifts southward outside the NSSA region. Our analysis reveals that out of the total contribution to surface ozone from biomass burning emissions in the NSSA region, 92% is due to NSSA biomass burning while the remaining 8% is from outside the NSSA. In fact, most (~75%) of the 8% comes from outside the African continent because little to no biomass burning occurs in Africa outside of the NSSA region during this time of year. However, during the summer months (i.e., July), most of the contribution to NSSA surface ozone (96%) is due to burning from outside NSSA. Only 10% of the 96% comes from outside the African continent because during this time most of the burning is from outside the NSSA but within the African continent. In spring (i.e., April) approximately equal percentages of contributions come from within and outside the NSSA region.},
 year = {2026}
}
TY  - JOUR
T1  - Quantifying Contributions of Biomass Burning to Air Quality in Africa
AU  - Richard Damoah
AU  - Xiaowen Li
AU  - Chibuike Chiedozie Ibebuchi
AU  - Kwabena Fosu-Amankwah
AU  - Kofi Asare
Y1  - 2026/01/31
PY  - 2026
N1  - https://doi.org/10.11648/j.ijema.20261401.13
DO  - 10.11648/j.ijema.20261401.13
T2  - International Journal of Environmental Monitoring and Analysis
JF  - International Journal of Environmental Monitoring and Analysis
JO  - International Journal of Environmental Monitoring and Analysis
SP  - 17
EP  - 30
PB  - Science Publishing Group
SN  - 2328-7667
UR  - https://doi.org/10.11648/j.ijema.20261401.13
AB  - One of the major sources of tropospheric ozone (O3) precursors such as nitrogen oxides (NOx), carbon monoxides (CO), and non-methane volatile organic compounds (NMVOCs) is biomass burning. The emissions from the burning not only affect air quality and climate locally, but also on a continental to hemispheric scales through long-range transport. We used NASA’s Global Modeling Initiative Chemistry and Transport Model (GMI-CTM), to quantify the changes in surface ozone over Northern Sub-Saharan Africa (NSSA: 0 – 20N, 20W – 55E), as triggered by biomass burning from different regions. During the winter months (i.e., January), most of the burning is concentrated in the NSSA region while in summer it shifts southward outside the NSSA region. Our analysis reveals that out of the total contribution to surface ozone from biomass burning emissions in the NSSA region, 92% is due to NSSA biomass burning while the remaining 8% is from outside the NSSA. In fact, most (~75%) of the 8% comes from outside the African continent because little to no biomass burning occurs in Africa outside of the NSSA region during this time of year. However, during the summer months (i.e., July), most of the contribution to NSSA surface ozone (96%) is due to burning from outside NSSA. Only 10% of the 96% comes from outside the African continent because during this time most of the burning is from outside the NSSA but within the African continent. In spring (i.e., April) approximately equal percentages of contributions come from within and outside the NSSA region.
VL  - 14
IS  - 1
ER  -
Climate Science Division, Morgan State University, Baltimore, United States;Center for Urban and Coastal Climate Science Research, Morgan State University, Baltimore, United States
Biography: Richard Damoah is Assistant Professor in the Climate Science Division at Morgan State, International Research Associate at the Latin American Technical University in El Salvador and the Director of All Nations University Space Systems Technology Laboratory in Ghana. He has more than 20 years’ experience in chemistry climate modeling, radiative transfer modeling, trajectory modeling, pollution measurement and data analysis with strong programming skills. Before joining Morgan Dr. Damoah had worked at (1) NASA Goddard Space Flight Center in Maryland as Associate Research Scientist under the GESTAR program, (2) University of Waterloo in Ontario, Canada as Research Fellow and (3) University of Edinburgh in UK as a Postdoc. Dr Damoah graduated with Bsc in Physics at University of Cape-Coast in Ghana, Msc in Environmental Physics at University of Bremen in Germany and PhD in Natural Sciences specializing in Air Pollution Transport Modeling, at Technical University of Munich also in Germany.
Research Fields: Air Quality, Climate Change, Atmospheric Pollution, Air Pollution Transport, Atmospheric Trajectory Modelling.

Climate Science Division, Morgan State University, Baltimore, United States;Center for Urban and Coastal Climate Science Research, Morgan State University, Baltimore, United States
Biography: Xiaowen Li is an associate professor in the Climate Science Division at Morgan State University. She has more than 20 years’ experience in atmospheric science. Dr. Li’s research interests include satellite meteorology, precipitation physics and dynamics, aerosol-cloud-precipitation interactions, regional atmosphere modeling, and climate sciences. Her recent interests include urban research, machine learning applications in atmospheric sciences, including data segmentation, microphysics parameterization and satellite data retrievals.
Research Fields: Atmospheric Physics, Satellite Meteorology, Cloud-Resolving Simulation, Urban Study.

Center for Urban and Coastal Climate Science Research, Morgan State University, Baltimore, United States;School of Computer, Mathematical and Natural Science, Morgan State University, Baltimore, United States
Biography: Chibuike Chiedozie Ibebuchi is an Assistant Professor in the Department of Mathematics at Morgan State University. He earned his Ph.D. in Climate Science from University of Wuerzburg, Germany, where his doctoral research focused on climate modelling, climate variability and change, and synoptic-scale weather patterns. His academic training also includes a Master’s degree in Hydroscience and Engineering; and a Bachelor’s degree in Applied Mathematics. At Morgan State, Dr. Ibebuchi’s work centers on synoptic climatology, climate variability and change, and the integration of machine learning and artificial intelligence into environmental science. He is also actively engaged in disaster risk management research, aiming to improve resilience and adaptation strategies in vulnerable communities. His teaching and mentorship emphasize bridging theoretical knowledge with applied solutions to pressing environmental challenges.
Research Fields: Synoptic Climatology, Climate Variability, ML/AI applications in Environmental Science, Disaster Risk Management.

Climate Science Division, Morgan State University, Baltimore, United States;Applied Physics Department, University of Technology and Applied Sciences, Navrongo, Ghana
Biography: Dr. Kwabena Fosu-Amankwah is a meteorology and climate scientist specializing in aerosol remote sensing, air-quality assessment, and climate–environmental monitoring in sub-Saharan Africa. He is a Postdoctoral Researcher in the Climate Science Division at Morgan State University, USA, and a Lecturer and Researcher in the Applied Physics Department at C.K. Tedam University of Technology and Applied Sciences, Navrongo, Ghana. He holds a PhD in Meteorology and Climate Science and an MSc in Environmental Science from the Kwame Nkrumah University of Science and Technology, and a BSc in Physics from the University of Cape Coast. His current work focuses on particulate matter exposure in public transport and commercial environments, validation of satellite-derived PM₂.₅ and NO₂ with ground-based sensors, and aerosol impacts on solar photovoltaic performance. He integrates satellite, in situ, and low-cost sensor datasets to improve air-quality monitoring and climate-service tools.
Research Fields: Atmospheric Remote Remote Sensing, Air Quality, Climate Science, Meteorology, Data Science, Energy, Agriculture and Food Security.

Ghana Atomic Energy Commission, Ghana Space Science and Technology Institute, Accra, Ghana
Biography: Dr. Kofi Asare is a Research Scientist and Manager of the Remote Sensing and Climate Centre at the Ghana Space Science and Technology Institute. He holds a PhD and MPhil in Geography with specialization in climate science, Earth Observation (EO), and environmental analysis. His research interests include climate modelling, satellite-based climate and air quality monitoring, hydrometeorological extremes, crop yield modelling, land-use and land-cover dynamics, and climate–health interactions. His current work contributes to the development of EO-driven decision-support systems. He is committed to advancing EO applications for climate resilience and sustainable development in West Africa.
Research Fields: Climate modelling, Remote Sensing, Air Quality, Climate Change, Agriculture and Food securing, Climate and Health.

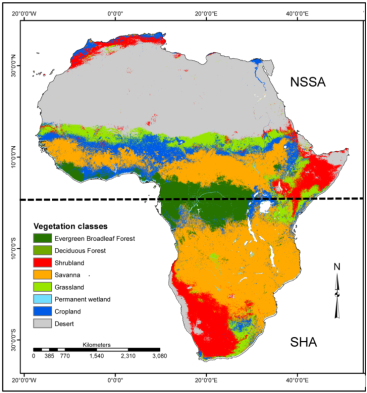
Figure 1. Vegetation classification in both NSSA and SHA (Southern-Hemisphere Africa) adopted from the studies [35].
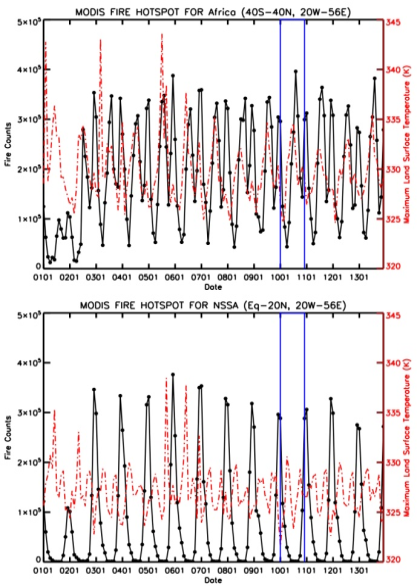
Figure 2. Monthly (2001-2013) comparison of fire counts (black) and land surface temperature (red) over the NSSA region (lower panel) and the entire African continent (upper panel), derived from MODIS observations.
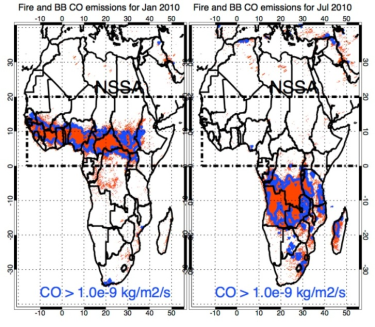
Figure 3. MODIS fire hotspots distribution (red) over Africa in January (left) and July (right) for the year 2010. The blue contours denote locations where biomass CO emissions are greater than 1.0e-9 kg/m2s. The burning is associated with high emissions of CO.
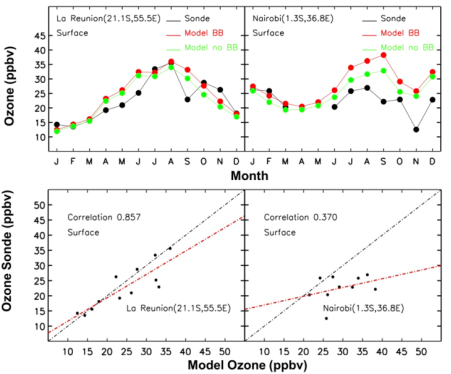
Figure 4. Modeled (red and green) and observed ozone (black) comparison at stations in Nairobi (right column) and La Réunion (left column). The upper row shows the monthly for 2010 whiles the bottom row shows the scatter comparison.
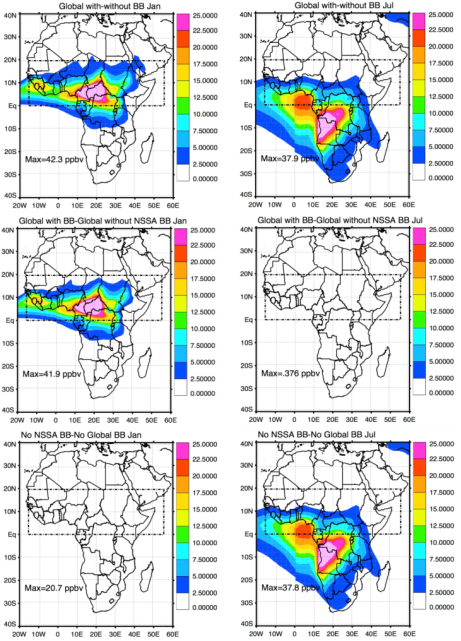
Figure 5. Spatial distribution of simulated surface ozone attributable to regional biomass burning for January (left column) and July (right column). The maximum numbers shown are global maximum concentrations.
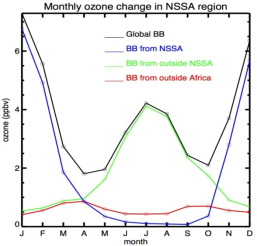
Figure 6. Monthly mean biomass-burning-induced (BB) surface ozone averaged over the NSSA region, with contributions attributed to all source regions (black), the NSSA region (blue), regions outside NSSA (green), and regions outside Africa (red).